
Living: Experiment #1
Experiment #1
Excellence of the experiment (motivation, rationale, objective, KPIs, target groups)
Industry 4.0 refers to a revolution where innovative digital instruments will be employed to improve the production process efficiency as well as the working conditions. However, this new approach is not the only way to achieve those critical objectives, and many companies implemented years ago quality management plans guaranteeing both, the production efficiency, and workers wellbeing. The nature of these solutions and their associated costs is totally different, and while Industry 4.0 schemes need important deployment costs, traditional management plans are supported by human resources. Companies should restructure, then. Thus, the Industry 4.0 adoption challenge is not necessarily technological but economical and strategic. And clear quantitative analyses showing the advantages (economical, societal, …) at short and long term are required to promote this revolution.
In this experiment we present a study case focused on the European bakery industry, where a sensing platform is employed to increase the global production process efficiency and the workers wellbeing.
This experiment tries to resolve the following challenge:
Challenge #1. Monitoring of relevant environment parameters of food production processes
GOAL#1:
Indicator: Thermal discomfort reduction.
Types: Productivity, behaviour, gender equity
Target value: Reduction in unitary annual number of thermal discomfort episodes in 10%.
GOAL#2:
Indicator: Real-time alert notification
Types: Productivity, delivery and time
Target value: Generation of alerts related to real time information in less than 30 seconds since error detection
Main concepts and hypothesis that are to be tested in the experiment
The hypothesis to validate is that by using current ICT framework provision in Cities2030, the GOALS #1 and #2 can be achieved. That is, it is possible to reduce the number of thermal discomfort episodes of food processing personnel by 10%, and it is possible to generate alerts related to realtime information in less than 30 seconds since error detection.
Variables such as temperature, humidity, power consumption and air quality are going to be monitored through sensor nodes. A framework of performance and economic indicators is generated, and we analyze their changes and envisioned evolution after the Industry 4.0 paradigm adoption.
To achieve that, we will use the S2CP platform, concretely, the Real-time data monitoring component developed by UPM-P20. Real-time data monitoring component provides a system for receiving events produced by sensors. This S2CP component can collect information generated in a city, farm or other food-related organization, so that information can be later represented for real-time visualization or monetization.
This component requires some data input coming from an Internet of Things (IoT) hardware platform, which must be defined and deployed in the pilot site. The output of this component will be a database containing all captured real-time information, expressed in a semantic and interoperable format (according to data models defined in T6.2), and also a visualization dashboard to facilitate data visualization, filtering and some simple analysis. Detailed component description is in D6.3.
Ideate and define the methodology
The challenge of monitoring of relevant environment parameters of food production processes is very abstract and need to be transformed into some quantitative measurable indicators. On the other hand, some indicators to valuate the adoption costs are also required, so the final viability of the Industry 4.0 transition may be analyzed.
Table 1 presents the proposed KPI framework. Production efficiency is represented by three groups of KPI: resource consumption, waste management and production capacity assurance. Resources may be associated to production activities (supplies costs, etc.) or to quality operations (materials or human resources). Proposed KPI evaluates all these factors.
Table 1. KPI framework
|
Production efficiency |
Workers’ wellbeing |
Adoption costs |
|||
|
ID |
KPI |
ID |
KPI |
ID |
KPI |
|
P1 |
Unitary power consumption |
W1 |
Unitary annual number of thermal discomfort episodes |
A1 |
Initial investment (total) |
|
P2 |
Reaction time (malfunction in production line) |
W2 |
Unitary annual number of lung infection |
A2 |
Initial investment (relative to production capacity) |
|
P3 |
Reaction time (malfunction in gas or power infrastructure) |
W3 |
Unitary annual number of intoxications |
A3 |
Annual maintenance costs (infrastructure) |
|
P4 |
Percentage of discarded products (quality tests) |
W4 |
Unitary annual number of general health problems |
A4 |
Annual maintenance costs (information) |
|
P5 |
Unitary quality monitoring costs (material) |
|
|
A5 |
Unitary maintenance costs (infrastructure) |
|
P6 |
Unitary quality monitoring costs (human resources) |
|
|
A6 |
Unitary maintenance costs (information) |
|
P7 |
Production infrastructure availability |
|
|
|
|
|
P8 |
Production infrastructure maintenance costs |
|
|
|
|
|
P9 |
Production infrastructure resiliency |
|
|
|
|
In this experiment we will focus on W1, P3, and P8, which are easier to measure.
Ideate and define the implementation
In the following figure the functional architecture of the solution is represented:
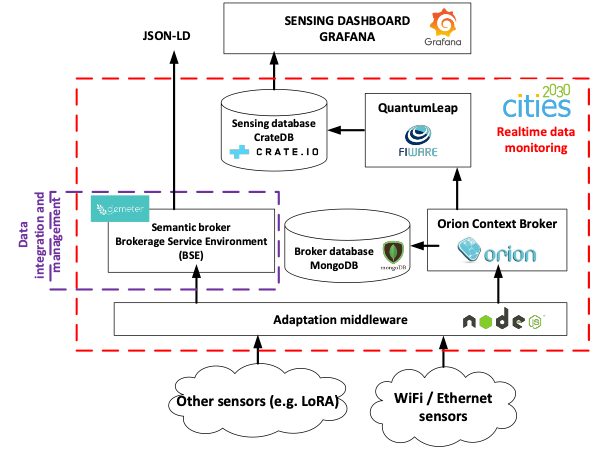
Different types of sensors can supply data to real-time data monitoring, such as WiFi/Ethernet sensors, and other sensors that communicate with well-stablished technologies such as LoRA or SigFox. A connector-based adaptation middleware serves as a communication proxy and transmits information to two types of brokers:
- The semantic broker BSE publishes the interfaces for data consumption through a semantic model compatible with the data integration and management tool, and based on semantic models from previous projects such as DEMETER.
- The Orion Context Broker is a FI-WARE component optimized for sensor data communication, which supports the NGSIv2 protocol.
To provide persistence to the information received by the sensor infrastructure, the QuantumLeap module is used, another FI-WARE component that saves all sensor updates in a CrateDB sensing database.
Finally, this database can be used as a source of information for the representation of the information received in a dashboard, for subsequent analysis, filtering and as a decision support system.
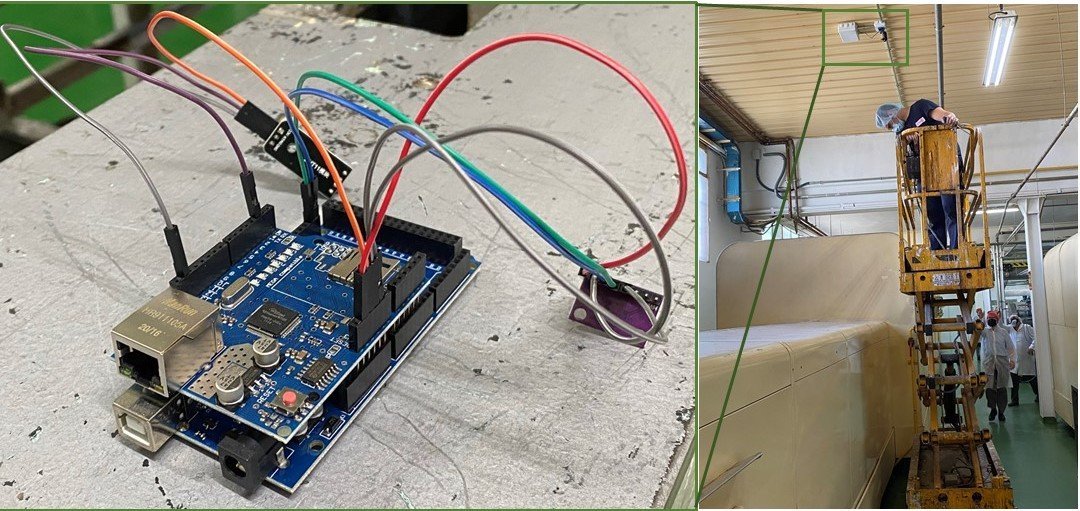
Phase #1: Creation of data acquisition system
Data will be captured by smart sensor nodes (powered by an Arduino Mega architecture with an Ethernet W5100 shield), combining various sensors:
- DTH-11 module to measure environmental temperature and humidity
- CCS811 module to monitor the air quality (equivalent CO2 -eCO2- and total volatile organic compounds - TVOC-).
Data structure will be expressed in JSON-LD format, by following Agricultural Information Model defined in the scope of DEMETER project (2019-2023).
Phase #2: Component deployment:
The components of the firmware (Orion Context, Broker, and QuantumLeap) as well as the databases are being defined for assembly in a Cloud environment. For this, Docker technology is being used, an open platform for developing, shipping, and running applications. Docker enables to separate the applications from the infrastructure so software can be delivered more quickly. Kubernetes technology is also being studied. Kubernetes is an open-source container orchestration platform that automates many of the manual processes involved in deploying, managing, and scaling containerized applications.
Future work will consist of the correct deployment of all the components of the architecture and the performance of data capture experiments, which can finally be represented in the dashboard.
Phase #3: Stakeholder’s engagement
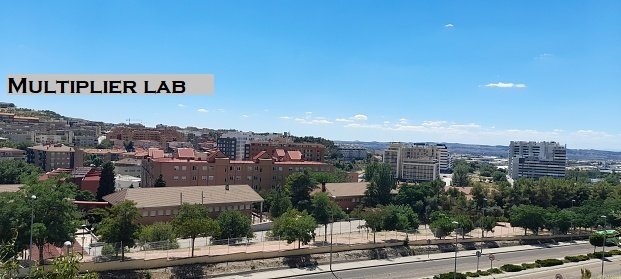
The described component will be employed in the scenario of the Arganda Lab, where data brokering solutions should be provided to improve food transparency and more information related to the food processing scenario, including environmental worker conditions.
An experiment in this lab has been defined:
- Improving the production efficiency and workers wellbeing through an Industry 4.0 sensing platform. Continuous and automatic monitoring should help companies to reduce resource consumption, waste, and improve the wellbeing and working conditions.
The real-time data monitoring component will be used to achieve this goal, considering the sensing platform, sensing database and middleware, the semantic broker, and the sensing dashboard. Through the information displayed in this dashboard, bakery companies may make decisions to improve their indicators.
Ideate and define the implementation
Both sensing networks (LoRa and WiFi/Ethernet) were deployed in the CODAN factory in Arganda (Madrid, Spain). CODAN is one of the biggest companies in the Spanish bakery sector. It has one large production center, where more than sixty different bakery products are manufactured. Specifically, it has five production lines with three electrical ovens. The following figure shows the deployed platform.
All software components were deployed in a private cloud in the Universidad Politécnica de Madrid. The underlying server was a Linux architecture (Ubuntu 20.04 LTS) with the following hardware characteristics: Dell R540 Rack 2U, 96 GB RAM, two processors Intel Xeon Silver 4114 2.2GHz, HD 2TB SATA 7,2K rpm.
In order to analyze the evolution of all indicators in the KPI framework, the following methodology was designed and implemented.
Data was collected for six months and all indicators were evaluated. In the third phase, the sensing platform deployed and was available for CODAN managers to make decisions for six months.
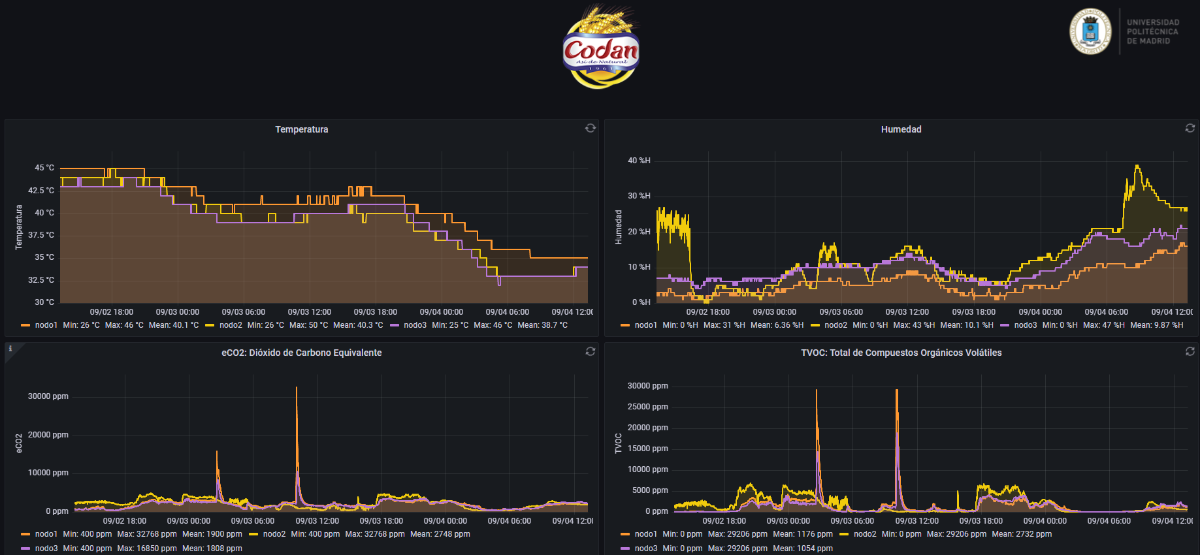
In the following figure it is possible to see the collected information:
Engagement plan:
The engagement plan considers a set of meetings with Arganda lab representatives. Preliminary results of the Arganda deployment experimentation will be presented to other Labs and other Cities2030 partners in R-215 "Fourth Workshop with Pilots" of M40.