Welcome
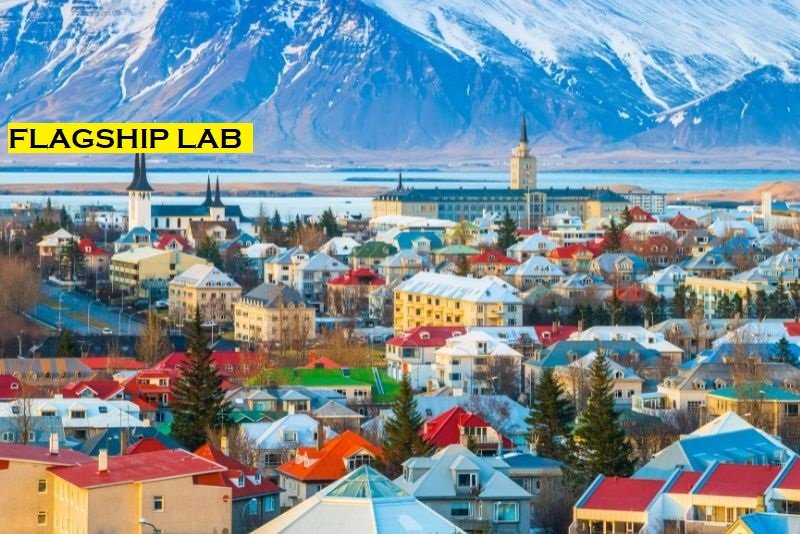
CRFS Scan – Reykjavík Capital Area, Iceland
The purpose of the CRFS Scan is to develop an overall view and description of the local context and to start characterising the city region food system. More specifically, it will begin to explore the overall structure and characteristics of the current food system for its different sustainability and food chain dimensions, analyse the functioning of the current CRFS, take stock of baseline information and identify gaps and provide, to the extent possible, an indication of general trends and critical issues relevant to increasing the sustainability and resilience of the CRFS under examination.
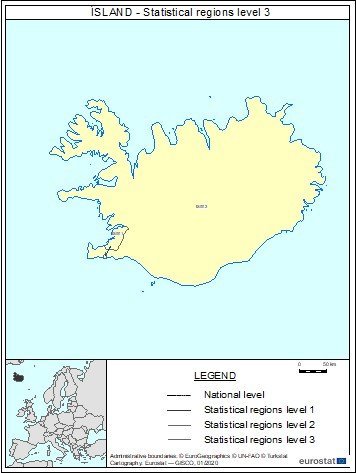
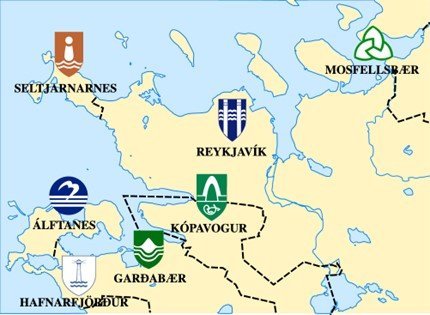
Map of Iceland and Greater Reykjavík area according to
NUTS classification
(Nomenclature of territorial units for statistics)
by Eurostat. Source: Eurostat.
Defining the CRFS
The subject of this City-Regional Food System Policy Scan is Greater Reykjavík Area (Icelandic: Höfuðborgarsvæðið). It is one of the eight regions of Iceland and also one of the two NUTS 3 regions (IS001) (Eurostat, 2022). It is in the southwest of the country. The population of the region was 233,034 (2020). The greater capital area of Iceland is made up of six municipalities: Reykjavík, Kópavogur, Hafnarfjörður, Garðabær, Mosfellsbær, Seltjarnarnes, Kjósarhreppur.
According to the Association of Municipalities in the Greater Capital Area, around 233,000 people lived there the capital area or about 64% of the country's population, with the biggest population in Reykjavík Municipality and the smallest in Kjósarhreppur. Reykjavík and the capital area have been a centre of trade, administration, and services in the country since the 19th century and have grown throughout the 20th and 21st centuries, becoming the capital of Iceland upon it gaining its independence in 1945. The municipalities of the Greater Reykjavík Area and their populations in 2020 were:
- Reykjavík 131,136
- Kópavogur: 37,959
- Hafnarfjörður: 29,971
- Garðabær: 16,924
- Mosfellsbær: 12,073
- Seltjarnarnes: 4,726
- Kjósarhreppur: 245
- Total: 233,034 (Population in January 2020)
Snapshot of the local context
Government entities and jurisdictional structures in the city region
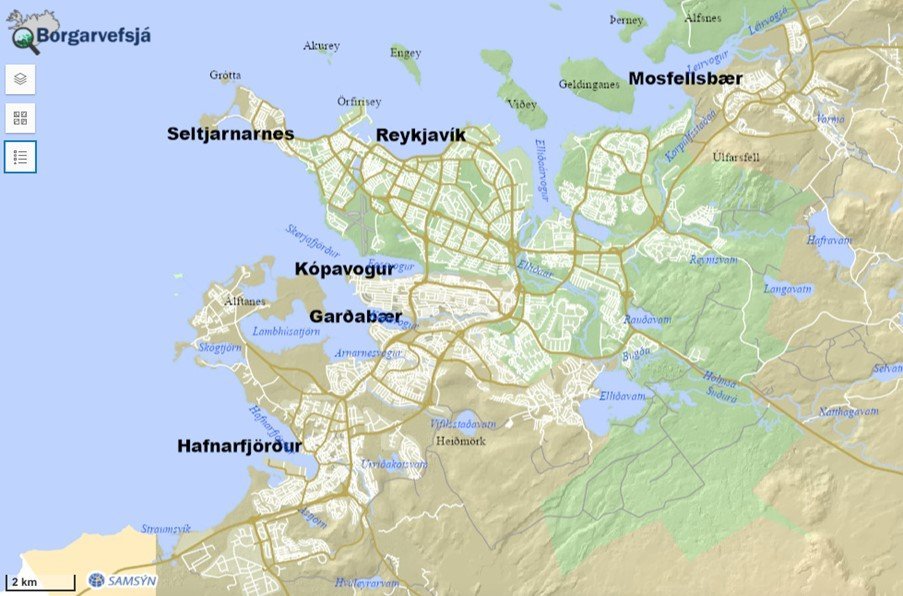
The main government entities and jurisdictional structures responsible for food policy in the capital area are the municipalities of Reykjavík, Kópavogur, Hafnarfjörður, Garðabær, Mosfellsbær, Seltjarnarnes, Kjósarhreppur and the Government of Iceland. There are also some international regulations and agreements that affect the food system in the capital area of Reykjavík, e.g., international ISO standards and European standards and trade agreements in which Iceland participates, such as EFTA.
municipalities of the Greater Reykjavík area
Natural resources and climate data (inter-annual variability of rainfall, river, and streams)
The climate is oceanic with a lot of rainfall and winds. According to the Icelandic Meteorological Office, in 2021, the annual mean temperature in Reykjavík was 5.4 degrees C, the total precipitation was 765.3 mm, which was a little lower (87%) than the mean precipitation between 1991 and 2021. The 100-year temperature average in Reykjavík (1920-2020) was 4.8 °C. The lowest annual average temperature was 2.8 °C and the highest was 6.1 °C, so based on these observations, the average temperature in Reykjavík is between 3-6 °C and rising slightly. Reykjavík experiences a cool maritime climate with relatively mild winters and cool summers. During winter the temperature is around freezing during the day and usually at night it freezes lightly. Under influence of the warm ocean water, the winter temperatures in the capital area usually do not drop much below zero, but at times can reach +10 or -20 degrees Celsius. On an annual basis, Reykjavík has around 1300 hours of sun, 800 millimetres (31.4 inches) of precipitation and 150 precipitation days.
The weather varies within the capital region, depending on, among other things, the height above sea level, distance from the sea and terrain. An increase of 100 meters lowers the temperature by 0.6°C. Proximity to the sea reduces fluctuations in temperature, both daily and seasonal. Topography, such as hills and valleys, can direct cold air currents as cold air is heavier than warm air and tends to descend. Temperature is also determined by proximity to the Earth's surface: air temperature is usually higher than surface temperature. The land surface in the capital area is in many areas sparsely populated, and land reclamation is undertaken in many places. There are lava fields with vegetation and patches of wetlands in the capital in good condition. The coastline is long and much of it is man-made. Arable land is scarce and mostly found in Mosfellsdal, Kjalarnes and Kjós. There is a potential for increasing vegetable cultivation in those areas. In the northern part of the capital area, there are rivers and lakes, and in the southern – forests and protected areas that are important for recreational activities
Surface areas (municipal area and city region; urban and rural area; urban growth patterns)
The capital area of Reykjavík is spread over 273 km², which is around 0,27% of the total area of Iceland. Most of Reykjavík greater area is comprised of urban fabric, but there are also natural areas used for recreation. According to the land use map, the Greater Reykjavík area is mostly comprised of discontinuous urban fabric, industrial and commercial units, and urban green areas. There is generally not a lot of land in the capital area that is classified either as agricultural land or pastures, and most of it is in the outskirts, near Mosfellsbær and Kjalarnes.
Demographic information including the number of inhabitants in the urban/rural/municipal area and city region; gender, age, race/ethnicity, geographical distribution of population groups, etc.
About 64% of the country's population lives in the capital area. Most of them live in Reykjavík, or more than half. About 16% live in Kópavogur, about 13% in Hafnarfjarðarbær, 7% in Garðabær, 5% in Mosfellsbær, 2% in Seltjarnarnes and about 0.1% in Kjósarhreppur. The capital area is also the most densely populated area in the country, with 218 inhabitants per square kilometer. Reykjavík is the most densely populated (527 inhabitants per square kilometer), while Kjósarhreppur is the most sparsely populated (0.8 inhabitants per square kilometer). The percentage of foreign nationals is increasing over the years. It is highest in Reykjavík (12.4%) and lowest in Garðabær (4%). The population is increasing in all municipalities of the capital region. This was true for all age groups in the years 1998-2019, but the largest increase was in the 50-59 age group. Recently, however, the number of people in the 0-9 age group has started to decrease. The percentage of university-educated people is higher in the capital area than in the countryside, but the percentage of those who have completed an undergraduate course or vocational training in secondary school is lower. Unemployment was 3.6% in the capital area in 2019, which is similar to the national average. The population in the capital area increased by 0.4% between 1 December 2020 and 1 March 2021. There are approximately 4,000 more men than women in the capital area (122,657 vs. 118,225), most aged 20-40.
Iceland is very homogenous when it comes to ethnicity, although that is gradually changing. In 2017, 91.1% of the country's population was of Icelandic origin. 4.1% are from Poland, 0.7% from Lithuania and 0.7% from Asia. About 0.5% are from other Nordic countries and another 0.5% from other European countries. In 2020, 19% of Icelanders were under the age of 15, 21.4% were between the ages of 15-29 and 21.2% were 30-44. 18.4% were between the ages of 45-59 and 14% were between the ages of 60-74%. Only 4.2% were aged 75-84 and 1.8% were over 80
Poverty/socio economic status for different groups and in different areas (urban/rural; municipal and city region): average household income, poverty level, employment statistics, spatial distribution of socio-economic characteristic
Iceland, including the capital region, is generally considered to be an affluent society with low levels of poverty. However, relative poverty is acute among low-income individuals and families. For instance, 37.5% of single parents are below the low-income threshold in Iceland, 13.7% of childless single people, and 8.4% of couples with children. In 2015, around 9.6% of individuals were below the low-income limit, while around 5% of individuals lived with a lack of material quality. Around 12.7% of children in Iceland are at risk of living in poverty and social isolation
Health, food security, hunger and malnutrition, food access: nutritional status of households, obesity rates and diet-related disease incidence, access to and availability of culturally suitable and nutritious diets (per population and income group, per area
Food and drink accounted for about 12.5% of people's consumption in the capital area in the years 2013-2016. The rate of obesity is higher in the countryside than in the capital area where almost 24% of children are under ideal weight, and 5.5% are obese. In rural areas, the percentage of overweight children is around 33%, and children with obesity – around 10%. The obesity rate is the highest in Iceland among the Nordic countries.
According to Bailes and Jóhannsson, the concept of food security in Iceland was not used until the financial crisis of 2008, and to this date it is not well-developed, even though it has been more frequently discussed recently in relation to climate change and the recent COVID-19 pandemic. Natural disasters, disrupted trade flows, global crises, such as the current war in Ukraine, and extreme climate events affecting global harvests are among the biggest threats to food security in Iceland. The country’s food and fuel reserves are lower than in other Nordic countries, contingency plans for food security on the regional and municipal level seem to be missing.
Relevant food related infrastructures (road network, markets, production, processing, storage and retail areas)
The capital area is accessible by water and air transport from abroad, and land, air and water transport domestically. There is a public bus system in Reykjavík capital area, but only about 4% of the population use public transport. 76% of all trips in the capital area are made by private car and 20% by foot and bicycle. There are two freight ports in the capital area, Reykjavík Port and Hafnarfjörður Port. They also count as fishing ports, in addition to
Kópavogur harbour
Land cover/land use; agricultural land use and production systems; open spaces in municipal area and city region
The Greater Reykjavík Area occupies around 4% of Iceland’s land and generates around 12% of its income from agriculture. The share of cattle in the capital region is about 2% of the country's total cattle population and remains stable, while the percentage of sheep is 1% and has decreased in the past two decades. However, the share of laying hens in the capital area is much higher – around 80% of Iceland’s laying hens are in the capital area and the southwestern Suðurnes region. There are no slaughterhouses in the capital area, but there are five dairy farms
Water use and quality
The water in Iceland is generally very good quality and can be drunk untreated. Groundwater is often used as drinking water, while geothermal water is used for domestic heating. An average Icelander uses about 130-150 litres of water per day, while each household uses an average of 4-5 tons per sq. meter of hot water per year. About 90% of this water is used for central heating. The bedrock in the capital area is rather porous and absorbs most of the plentiful rainfall, which then flows to the sea. The water protection area of the capital region extends from Bláfjöll to Vatnsleysustrandarhreppur, south to Grindavík and east towards the borders of the municipality of Ölfus. Sewage system in the capital area is very basic, with most of sewage getting piped directly into the sea after putting it through a sieve. As a result, microplastics flow out with the sewage, and there is a heightened risk of faecal pollution
Food prices for different food crops (past, current, expected trends)
Food prices are rising in all supermarkets in Iceland due to the global energy and food crisis caused in part by the war in Ukraine as well as other pre-existing factors, such as inflation. In comparable stores, the price levels in the capital area and the countryside are similar, but products such as e.g., vegetables and fruits are cheaper in the capital area than in the countryside due to a larger supply.
National/provincial data on food imports for different food items/ origin of import (national, regional, global)
Data gaps should be noted so they can be addressed in the subsequent stages of the CRFS scan. As much as possible data should spatially mapped using GIS.
Almost all the meat and dairy products consumed in Iceland are produced locally, while most other types of food are imported, as are agricultural feed materials and fertilizers. It has been estimated that Icelanders import around half of their food (calory intake)